
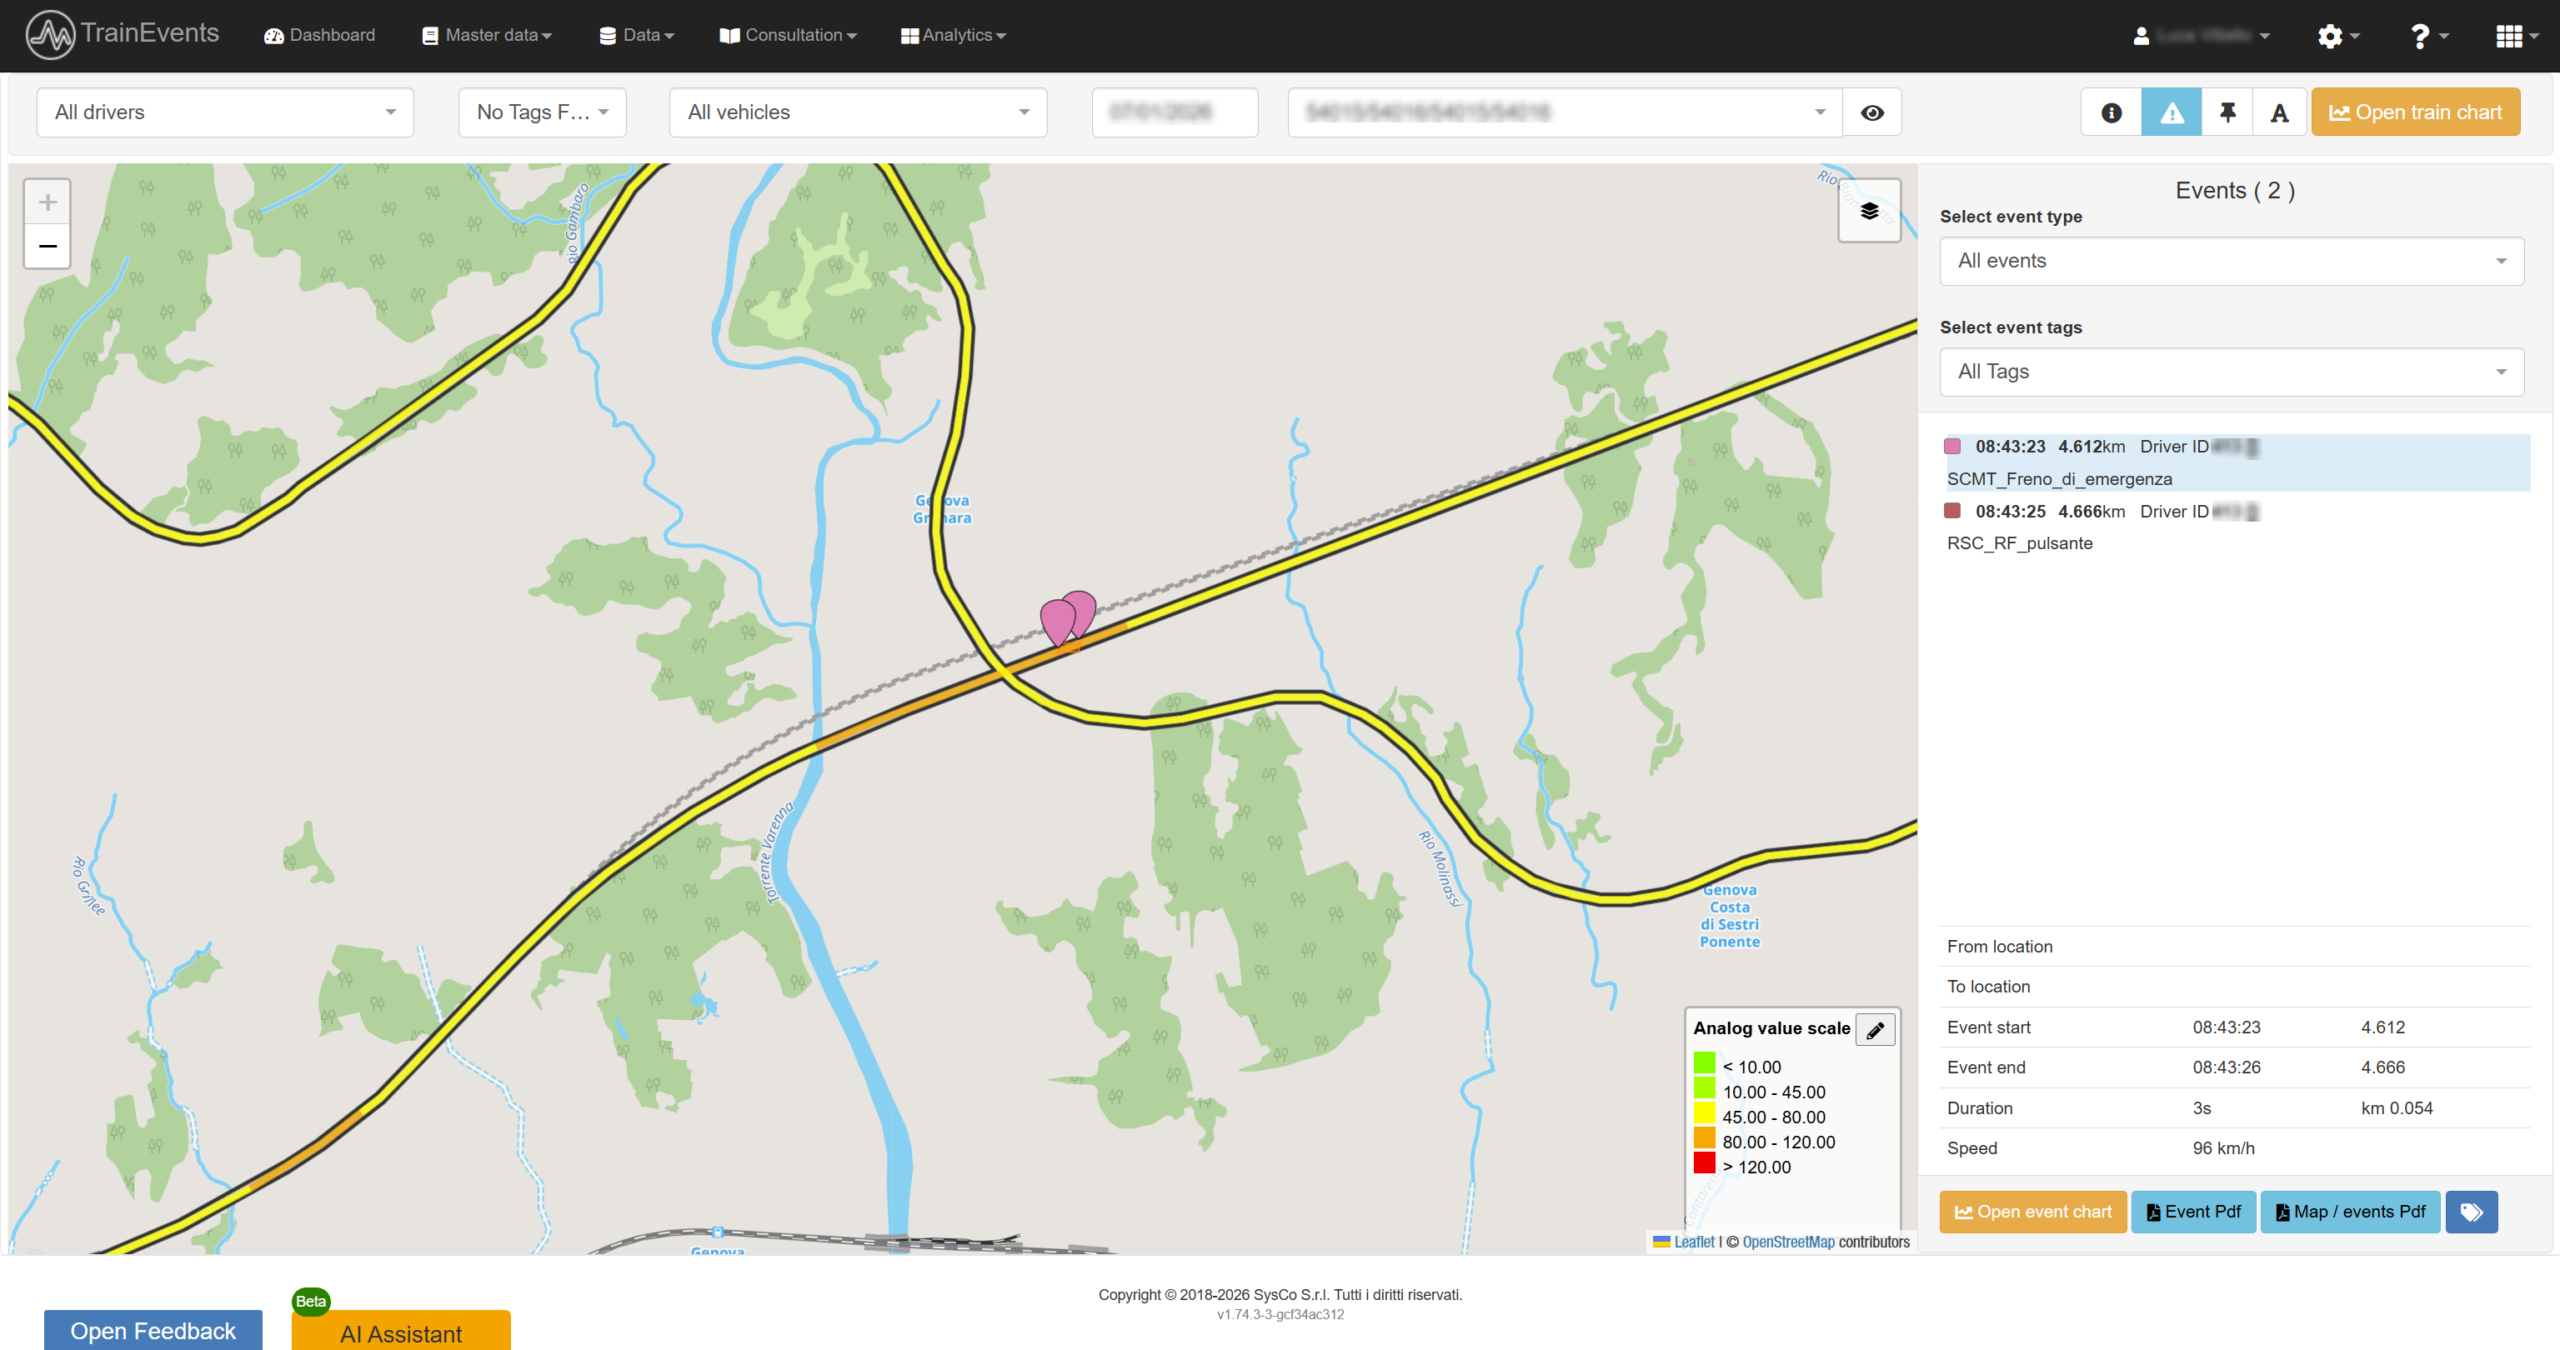
Map Views
Visualize trains and zone alerts on a high-definition interactive map. Switch seamlessly between Railway and Satellite views to get the full context of your operations.
- Identify specific trains in real-time.
- Monitor global alert frequency and status.
- Export detailed reports with spatial and temporal data.
- Analyze events directly on the integrated charts.
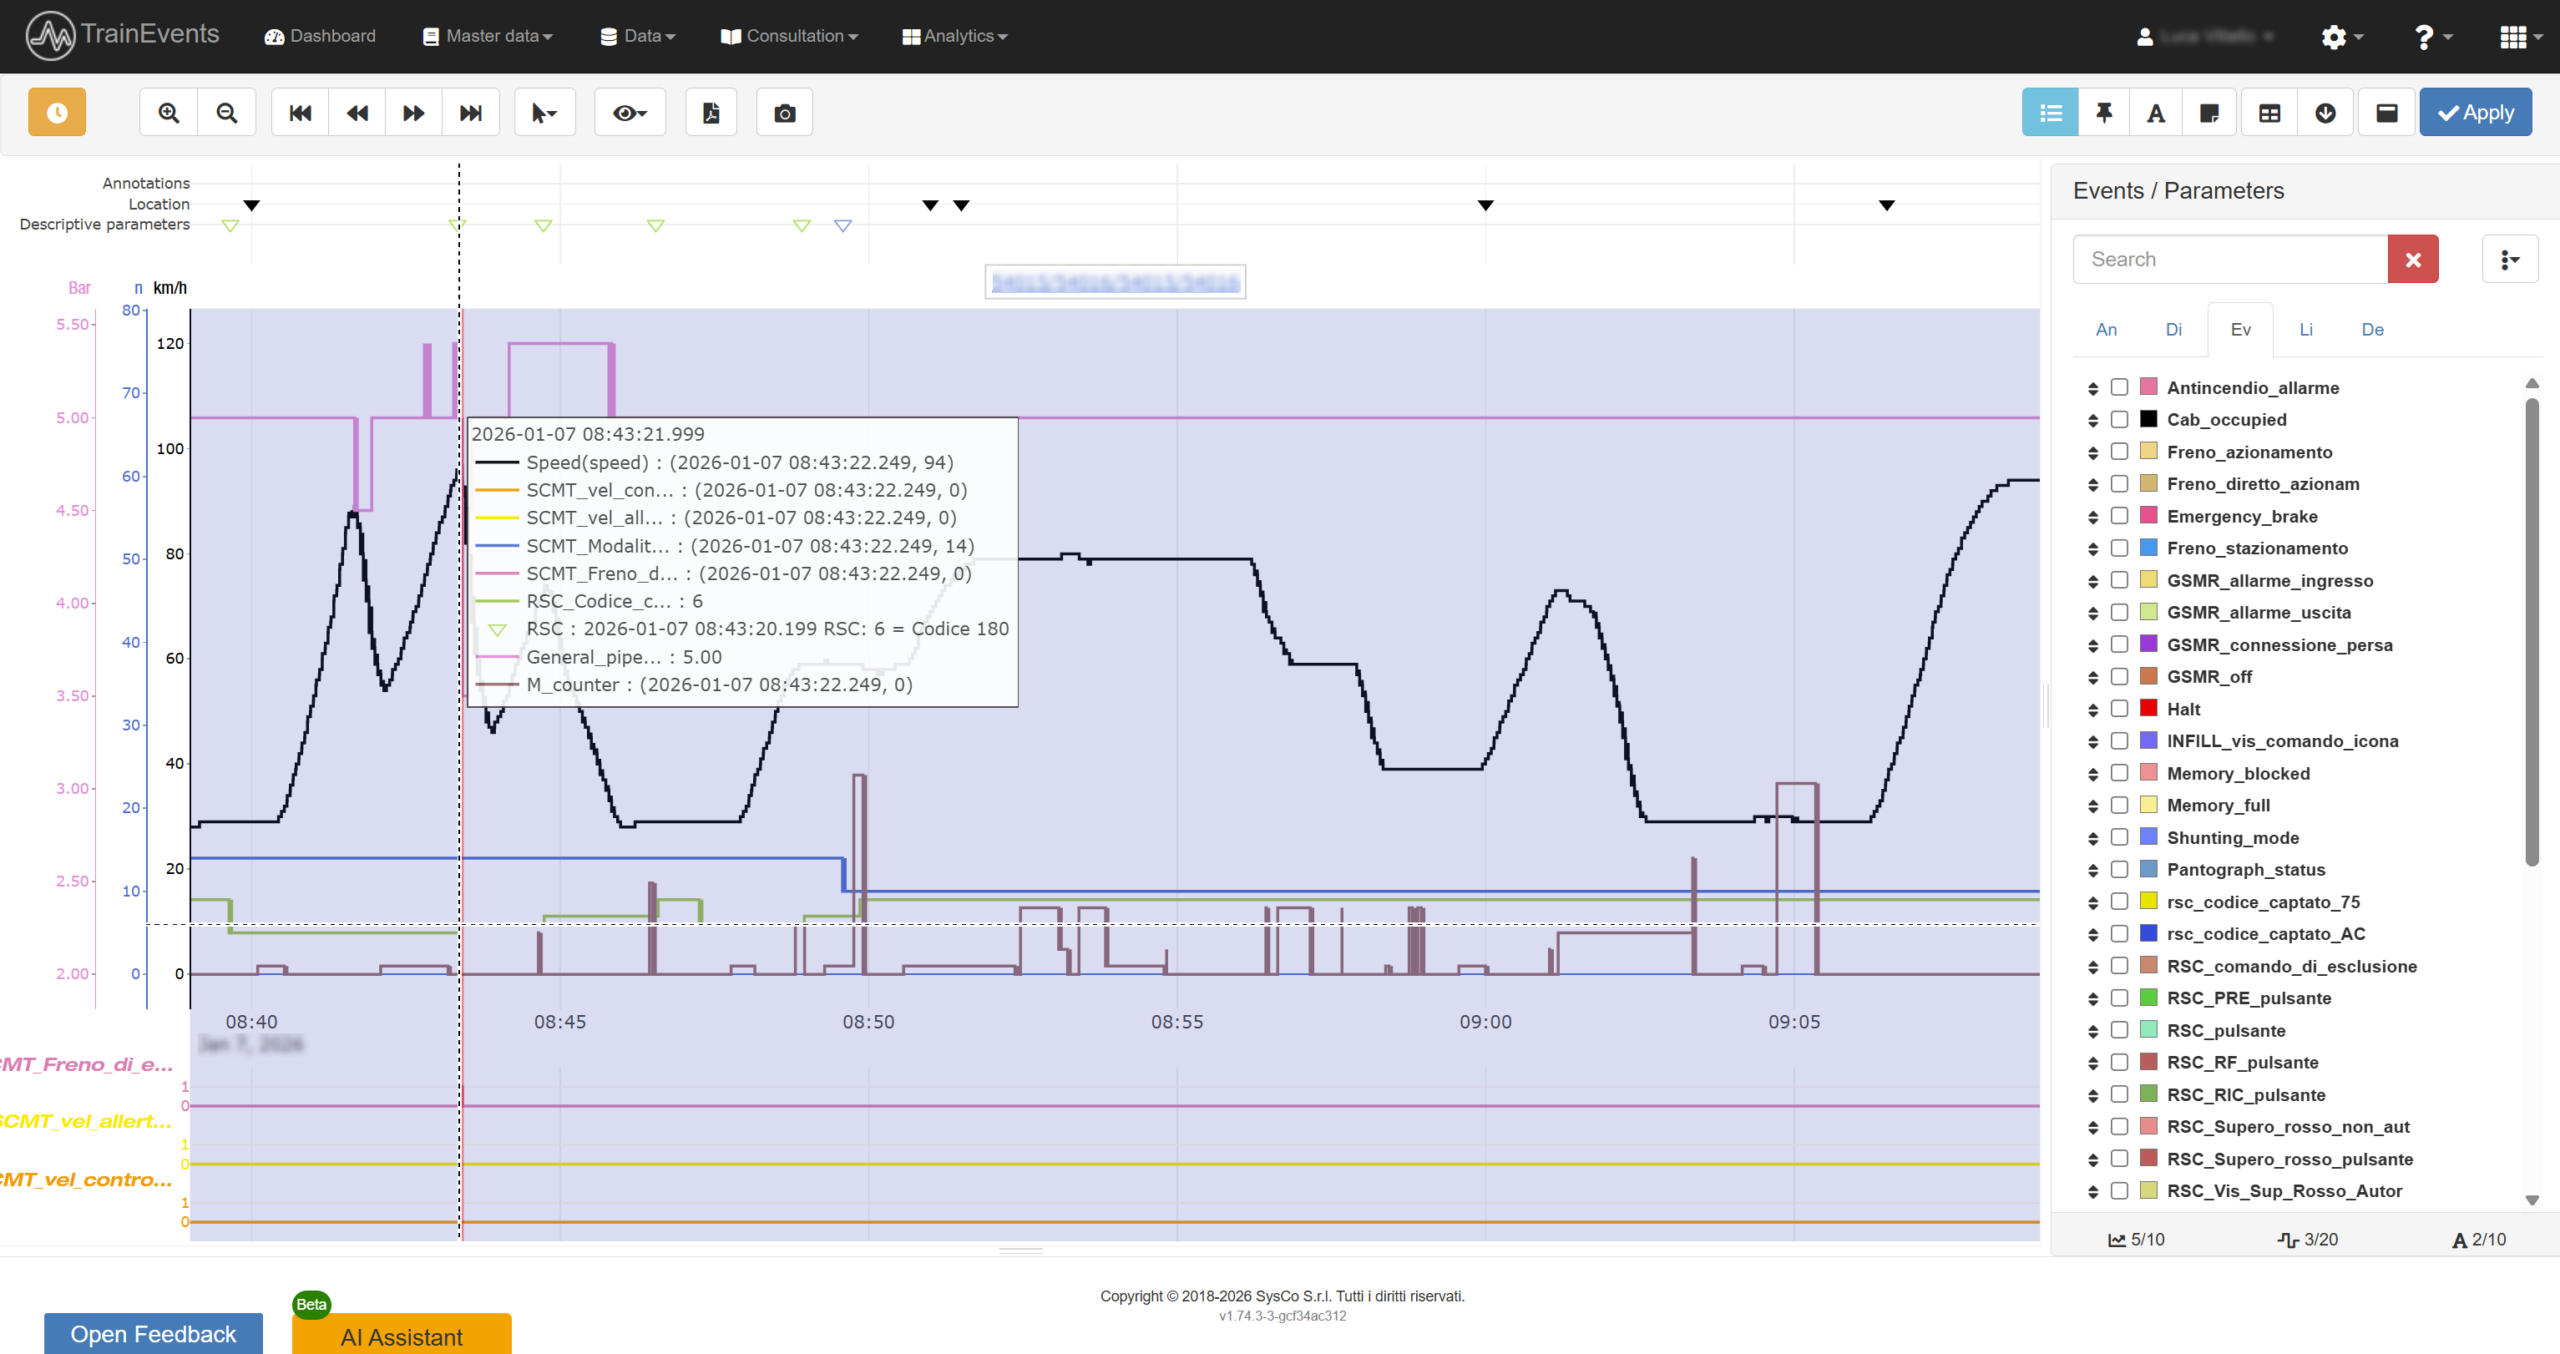
Chart Views
Monitor analog and digital trends on a time-based or distance-based scale. A flexible interface designed to turn complex data into clear insights.
- Dynamic Navigation: Seamlessly scroll through the timeline to review data points.
- Precision Zoom: Focus on micro-details or expand for a high-level overview.
- Full Customization: Personalize data selection, order, and colors.
- Team Collaboration: Add notes and comments to specific events for detailed remote analysis.
- Data Export: Save charts as images or export raw data for further reporting.
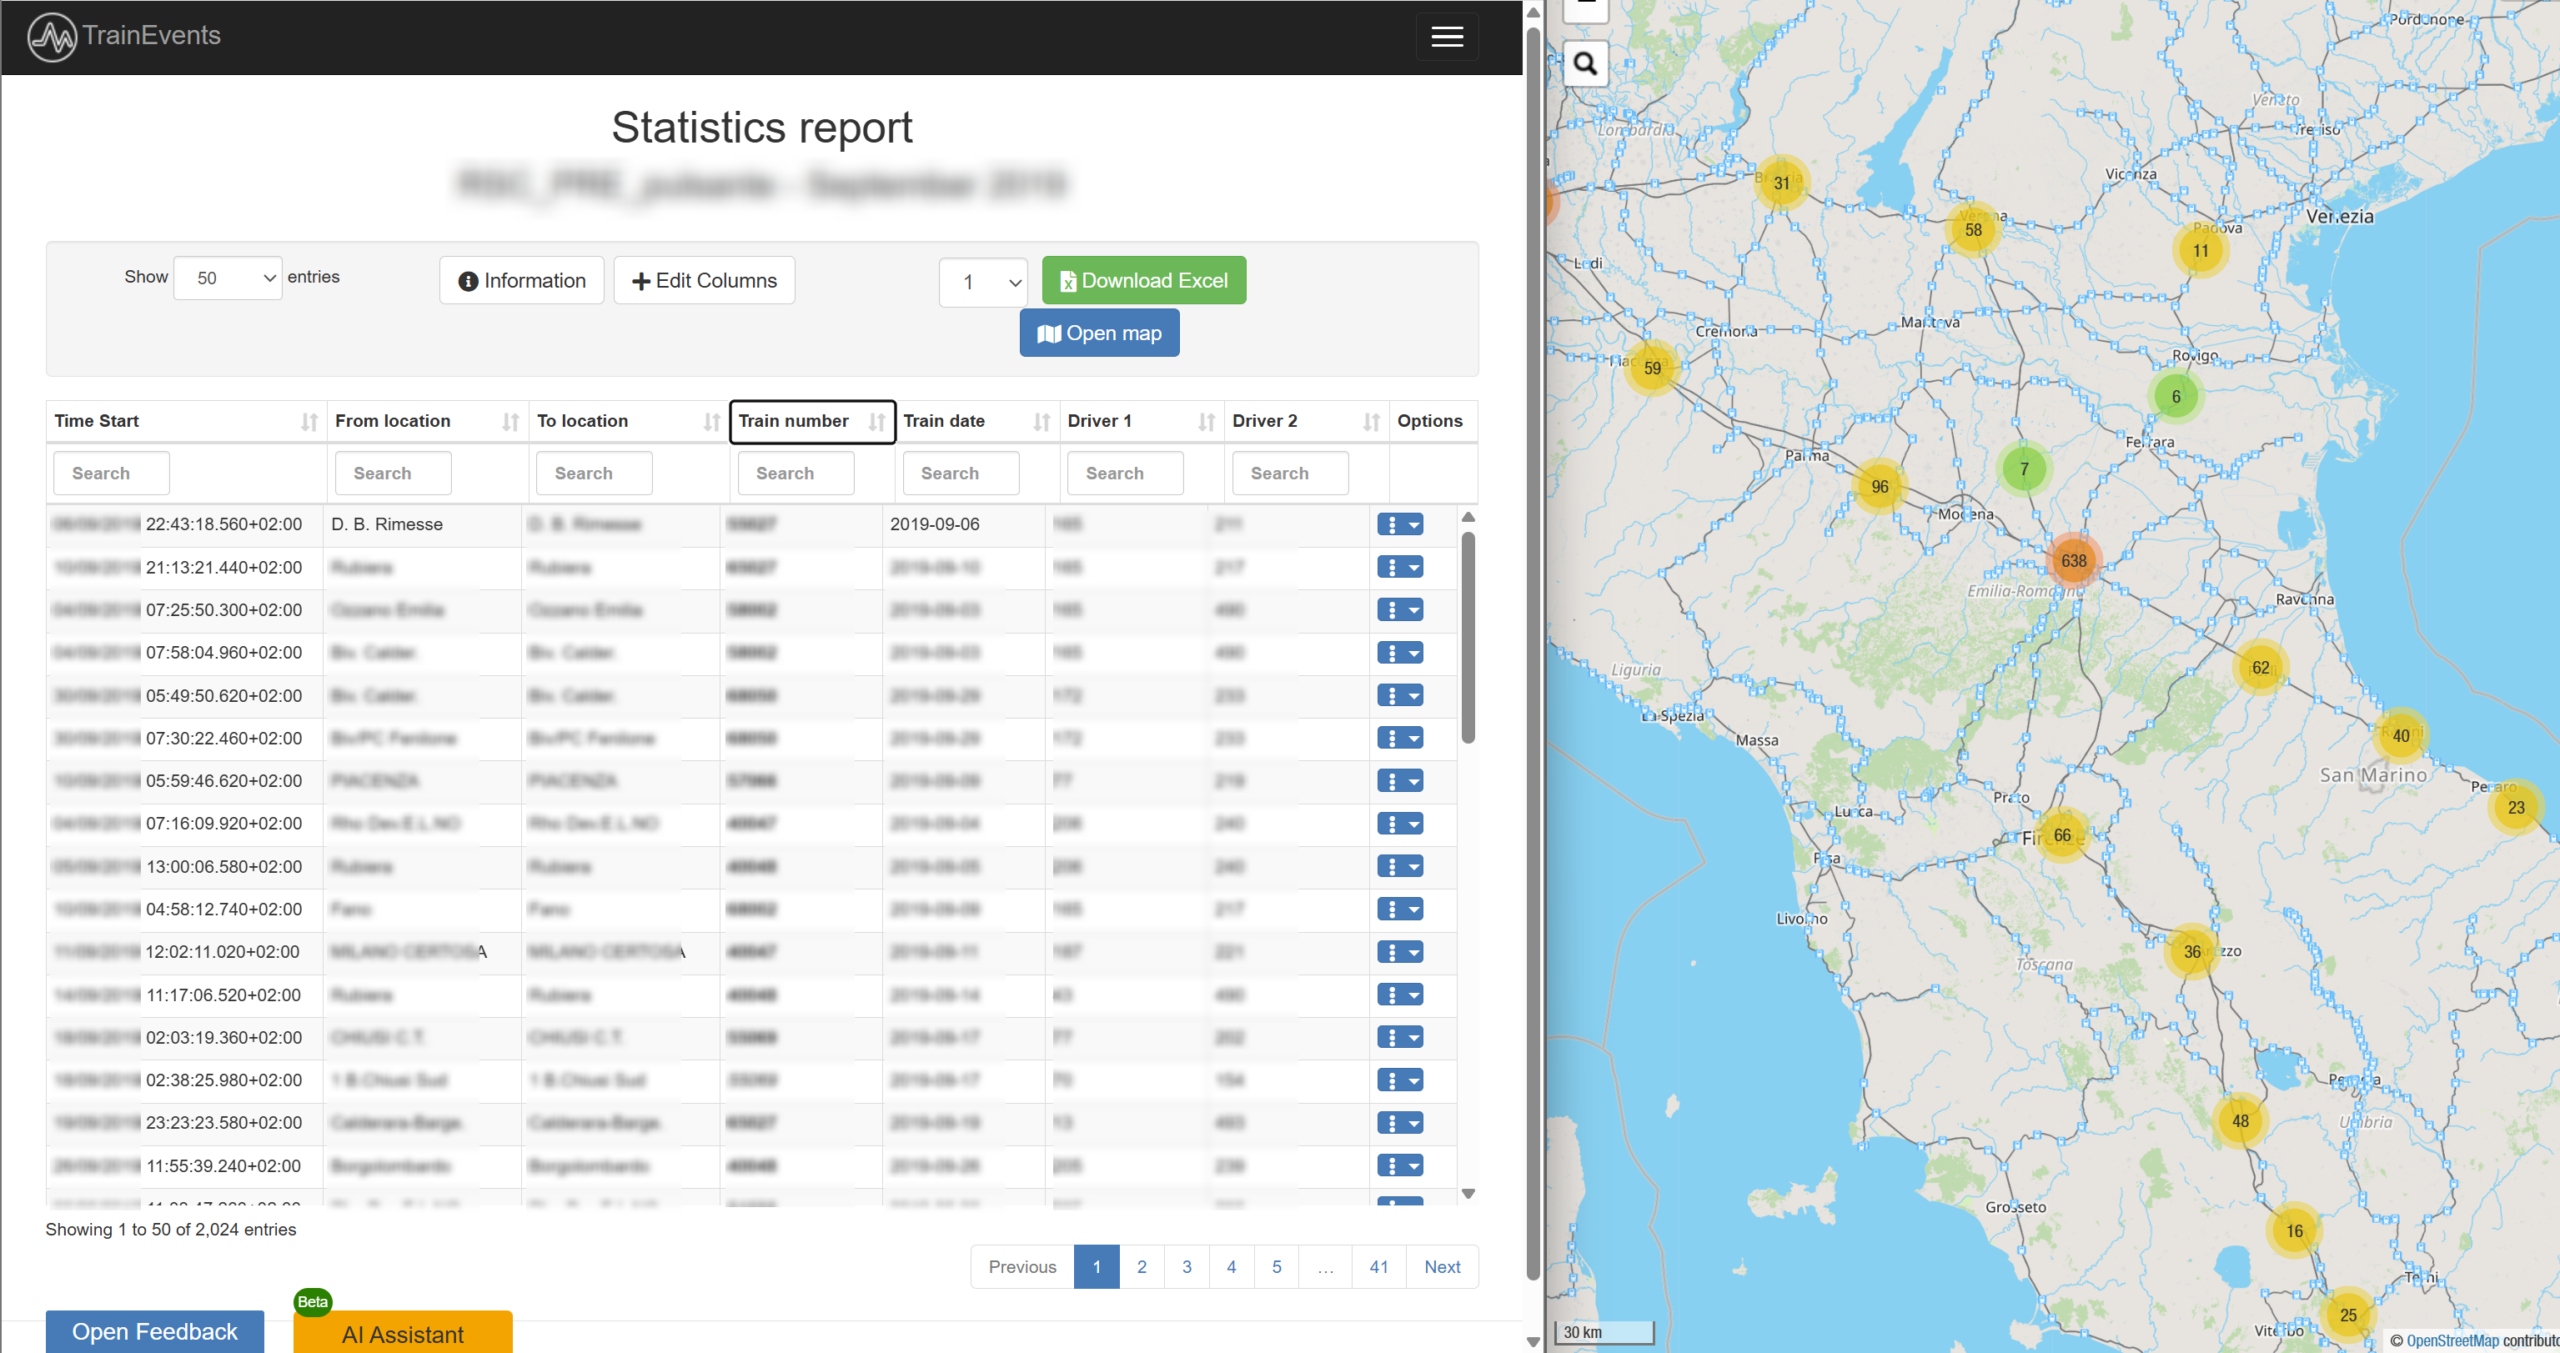
Reporting & Analytics
The ultimate tool for data extraction and analysis. Generate detailed reports and optimize operational management through advanced filtering and clustering.
- Advanced Filtering: Export data by period, train, vehicle, or driver.
- Custom Reports: Define specific detail levels and data categories.
- Smart Notifications: Set up automated email alerts based on your needs.
- Geospatial Clustering: Identify recurring event patterns across the network.
- Training Support: Help instructors pinpoint where drivers need additional support.
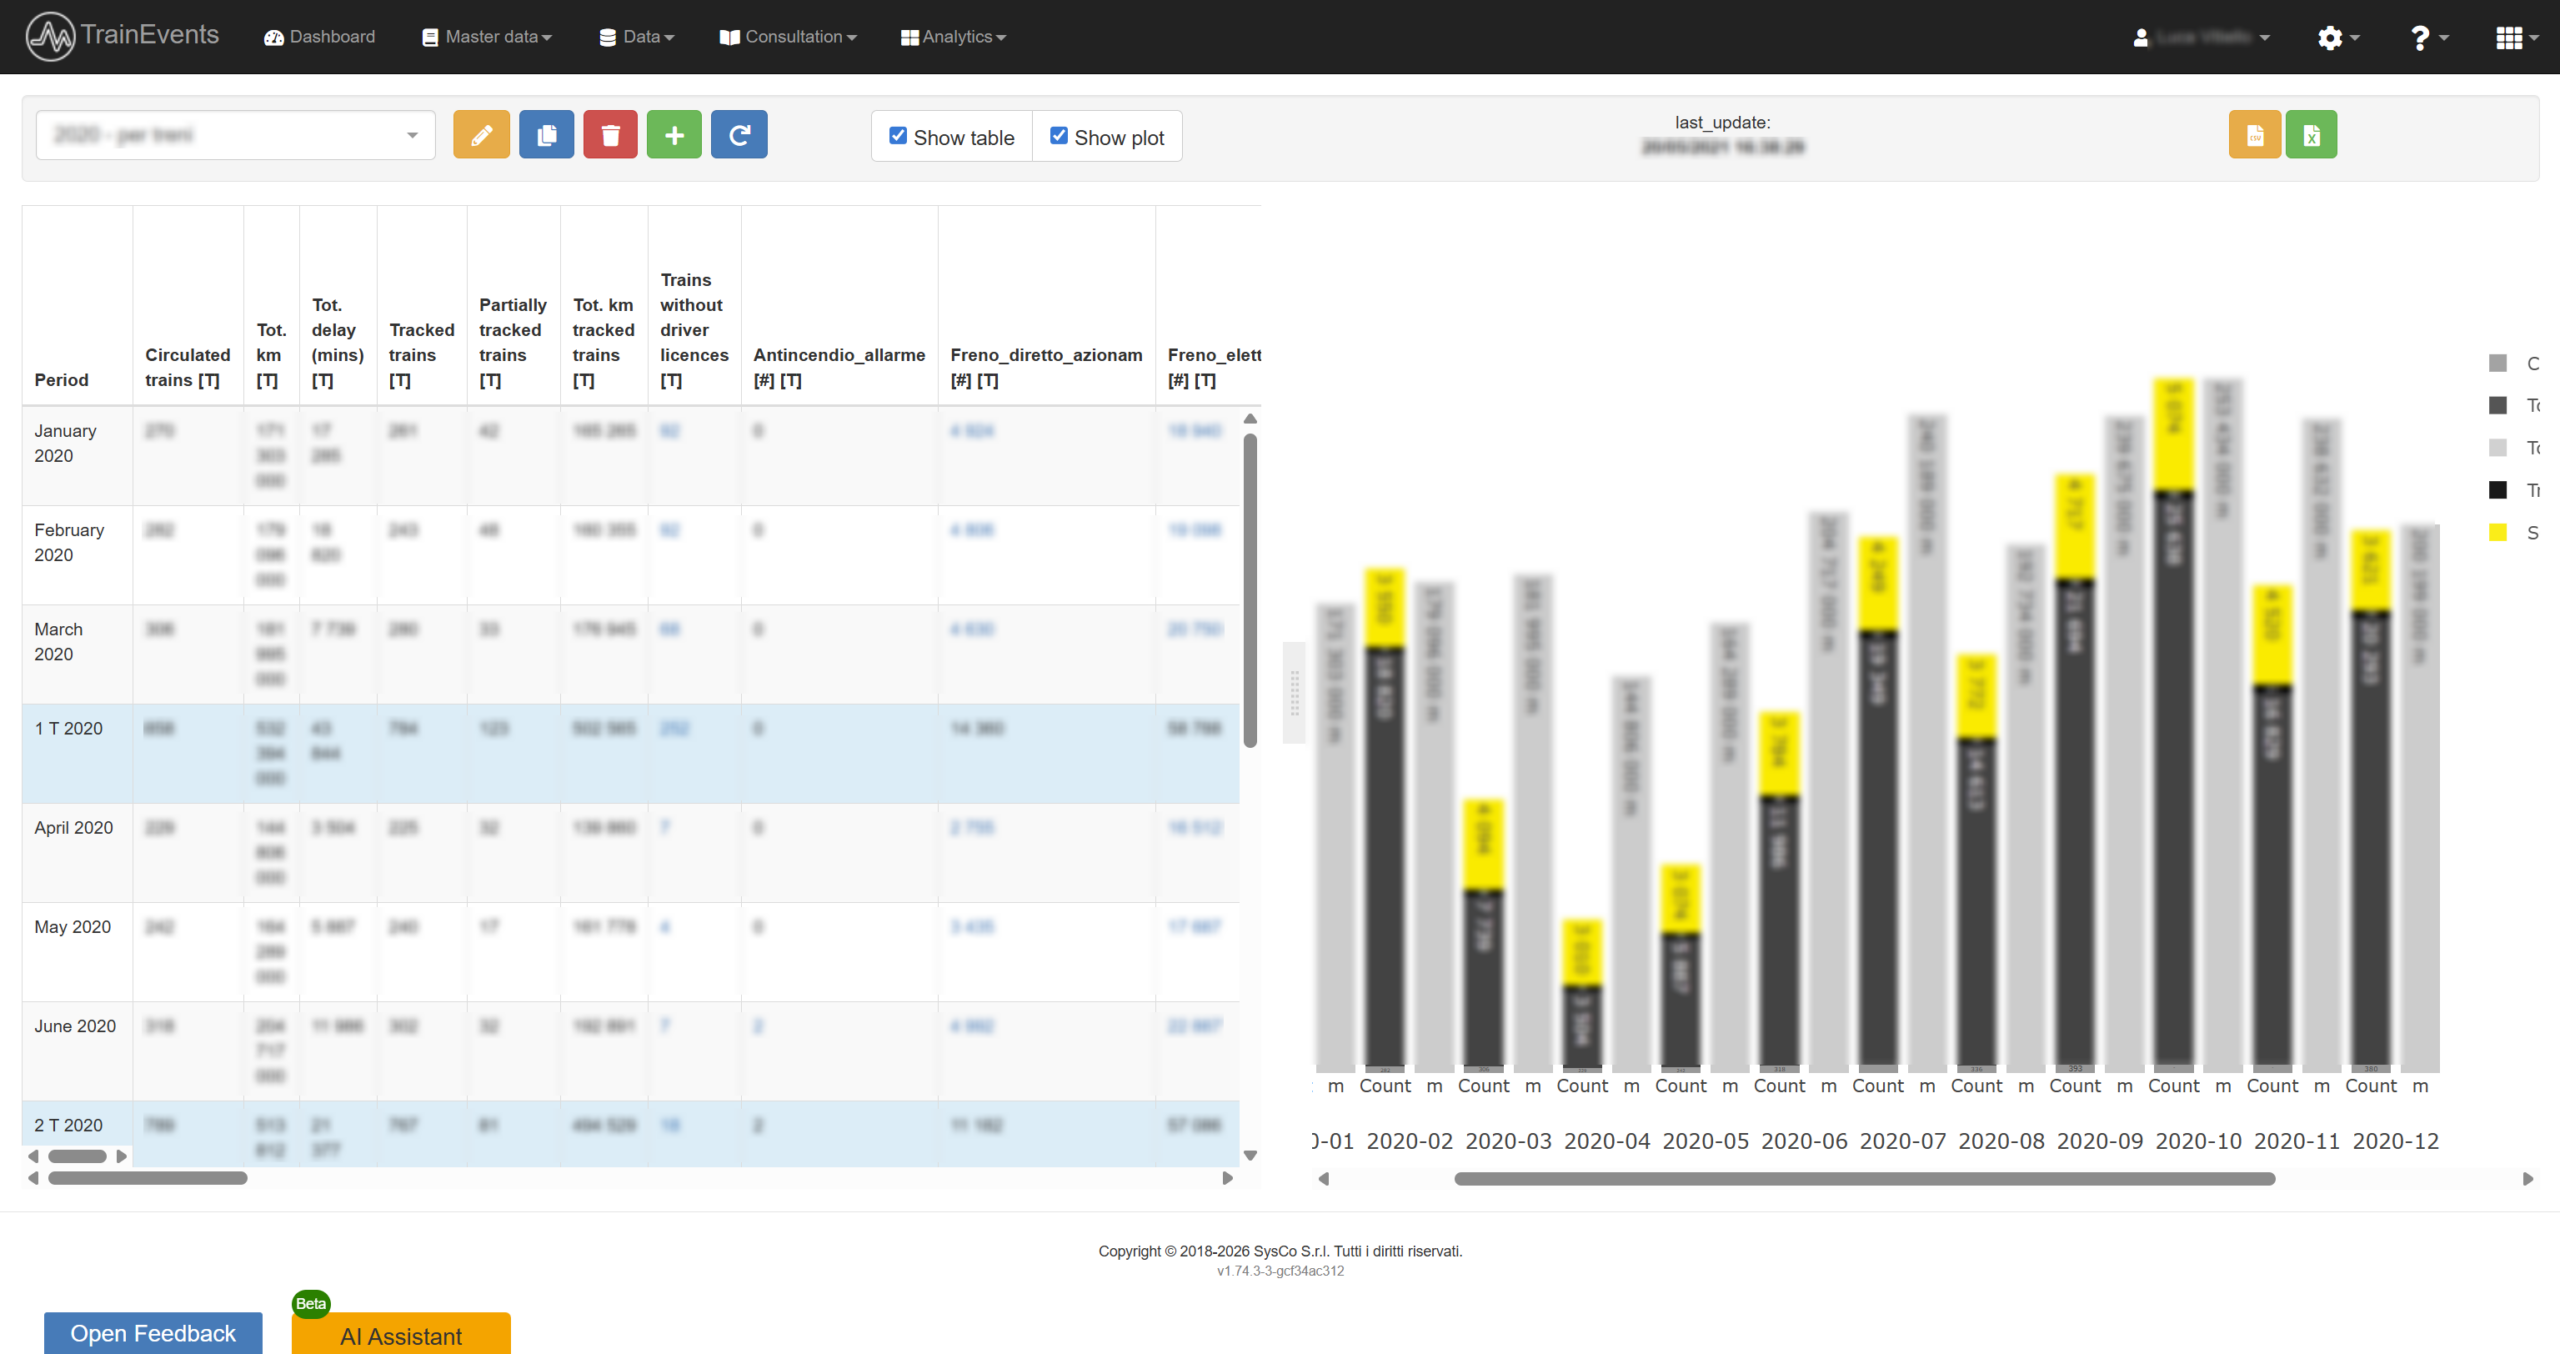
Statistics & Performance
A 360° view of your operations. Monitor both train performance and personnel behavior in response to defined events.
- Data Insights: Instant stats via interactive charts and tables.
- Behavioral Tracking: Monitor operational behavior and event response.
- Custom Views:Create and save your own personalization sets.
- Flexible Export: Generate and download reports in your preferred format.